
Published Date: May 1, 2026 | Last Updated: May 28, 2026
Overview
The Dashboard is the default landing page in Tello IAM and the recommended starting point for routine platform review. It provides a real-time summary of the platform's current state — surfacing failed operations, detected anomalies, and access activity that requires Administrator attention without requiring a full review of individual User records or integration logs.
Navigate to Dashboard in the left navigation to access it at any time.
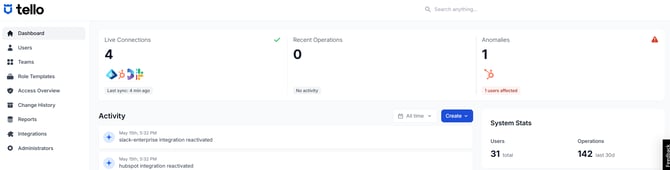
What the Dashboard shows
The Dashboard aggregates activity and status information from across all connected integrations and User records. Key areas include:
- Live Connections - Displays how many integrations are active and can be used as a shortcut to the Integrations tab.
- Recent Operations — Displays the recent operations that have been triggered in the last 24 hours. This module can be expanded and you can change the time filter to expand the results displayed.
- Anomalies — Drift events and access discrepancies that have been flagged for review. These represent permission changes that occurred in a connected application outside of Tello IAM. Select an entry to navigate to the affected User record and resolve the anomaly.
- Activity — a summary of recent provisioning operations across the platform, providing a quick view of what Tello IAM has executed.
- System Stats - Shows details of users and operations in the system.
Using the Dashboard for routine monitoring
The Dashboard is designed to answer one question at a glance: does anything require attention right now? The recommended monitoring practice is to review the Dashboard regularly — daily for active environments — and address any failed operations or anomalies before they accumulate.
A clean Dashboard indicates that all recent operations completed successfully and no drift has been detected across connected integrations. Any items surfaced on the Dashboard should be investigated and resolved before they are considered closed.
Responding to failed operations
A failed operation on the Dashboard means Tello IAM attempted a provisioning or deprovisioning action and did not succeed. Common causes include an integration that has lost authorization, a misconfigured permission in a Role Template, or a User record with missing required attributes.
To investigate: select the failed operation to open the full entry in Change History. Review the error detail, address the underlying cause, and retrigger the operation or resync the affected integration.
If you are unable to resolve an error regarding a failed operation, contact Support@SeasoftSecurity.com for assistance.
Responding to anomalies
An anomaly on the Dashboard indicates that a User's permissions changed in a connected application outside of Tello IAM — a drift event. Left unresolved, drift means the actual state of access in the connected application no longer matches what Tello IAM has configured.
To investigate: select the anomaly to navigate to the affected User record. Review the issue detail and resolve it by choosing whether to enforce the Tello IAM configuration or accept the change from the source application. See Monitoring: Drift Detection for full resolution steps.
Related articles
- Monitoring: Drift Detection — how drift is detected and how to resolve anomalies
- Monitoring: Change History — full log of all platform operations
- Managing Users — resolve access issues on User records
 Seasoft Security Solutions LLC | TelloIAM